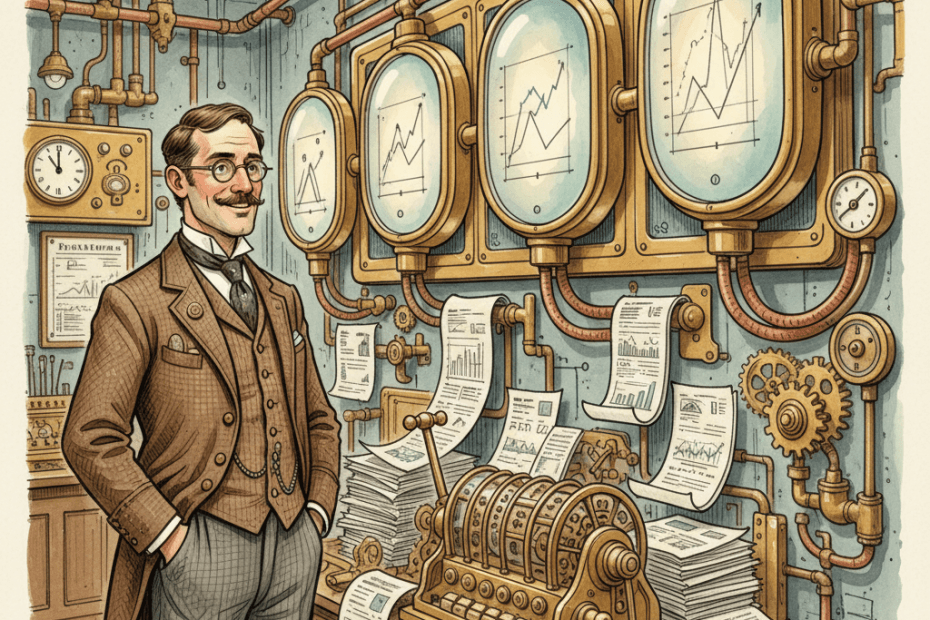
Google Ads is starting to show a new kind of reporting tool in some advertiser accounts: an AI-powered dashboard that can turn a plain-English request into charts, tables and a written summary.
The feature was announced earlier in the year and is now appearing in a limited number of accounts, according to reports from Search Engine Land and Search Engine Roundtable. It is built with Google’s Gemini technology and is intended to make account analysis quicker. An advertiser might ask for a view of performance by campaign, device or time period instead of assembling every report manually.
For businesses in Bath and across the South West, that sounds useful. It may well be. But a faster chart is not automatically a better decision, and an AI-generated explanation should be treated as a starting point rather than the final word.
What the new dashboards appear to do
Google describes the dashboards as a data visualisation, analysis and export tool. A user can enter a text prompt and the interface creates a visual report using data already held in Google Ads. The dashboard can update as the request changes and can also produce a summary intended to explain what the figures show.
That could remove some of the friction from routine reporting. A retailer could ask to compare weekend and weekday performance. A hospitality business could look at campaign results around an event. A professional-services firm might compare leads by campaign and device, provided its conversion tracking is set up properly.
The important qualification is that the rollout is not yet universal. Reports say the feature is live in some accounts, so businesses should not assume they have it or reorganise their reporting around it just yet.
The dashboard only knows what the account knows
AI does not repair weak measurement. If a Google Ads account counts every form-page visit as a lead, misses telephone enquiries or imports sales inconsistently, the new dashboard will create a polished view of incomplete information.
That matters particularly for local businesses, where the journey from advert to sale is often messy. Someone may click an advert, return through organic search, call later and buy offline. A neat chart can make the result look more certain than the underlying tracking allows.
Before relying on an AI summary, check that the account’s primary conversions represent genuine business outcomes. Separate valuable enquiries from softer actions, such as viewing a contact page. Where possible, connect qualified leads or completed sales back to the advertising source. Our Google Ads work in Bath starts with that measurement foundation because optimisation is only as reliable as the signals supplied to it.
Useful questions to ask first
If the dashboard appears in your account, begin with narrow, verifiable questions. Good early examples might include:
- Which campaigns changed most in cost and conversions over the last 30 days?
- How does mobile performance compare with desktop for the same conversion action?
- Which locations show high spend but few qualified enquiries?
- Did a fall in conversion volume follow a change in clicks, conversion rate or tracking?
Then compare the generated report with the standard campaign tables and your analytics or customer relationship management system. If the summary claims to explain why performance changed, look for evidence. A correlation in the account is not necessarily the cause. Seasonality, stock, pricing, website problems, local events and changes in enquiry quality may sit outside Google Ads.
Do not let convenience hide the settings
Natural-language reporting lowers the barrier to exploring data, which is welcome. It may help owners and managers ask questions without knowing how to build a custom report. It could also encourage people to accept the first attractive visualisation without checking filters, date ranges, attribution settings or conversion definitions.
Keep a record of the prompt, the date range and the metrics used when a dashboard informs a budget decision. That makes the result easier to reproduce and discuss. It is also sensible to avoid placing confidential customer information in prompts; the feature should be used to query appropriate advertising data, not as a place to paste sensitive business records.
The same principle applies across paid and organic search marketing: tools can accelerate analysis, but someone still needs to judge whether the question, data and conclusion make commercial sense.
What Bath and South West advertisers should check now
First, see whether AI Dashboards are available in your account, while recognising that access is still rolling out. Second, audit the conversions and values feeding Google Ads before testing any automated explanation. Third, choose one recent business question whose answer you already understand and use it as a controlled test.
Compare the AI-created output with your existing report. Check whether it uses the expected campaigns, dates and conversion actions. If it gets the basics right, try a slightly more complex question. If it produces a confident explanation that the underlying data cannot support, treat that as a useful warning about its limits.
Google Ads AI Dashboards could make reporting more accessible and save time. Their real value will not come from producing more charts, though. It will come from helping businesses ask better questions, verify the answers and connect advertising activity to outcomes that genuinely matter.
Sources: Search Engine Land; Search Engine Roundtable.